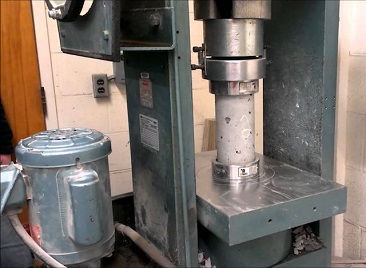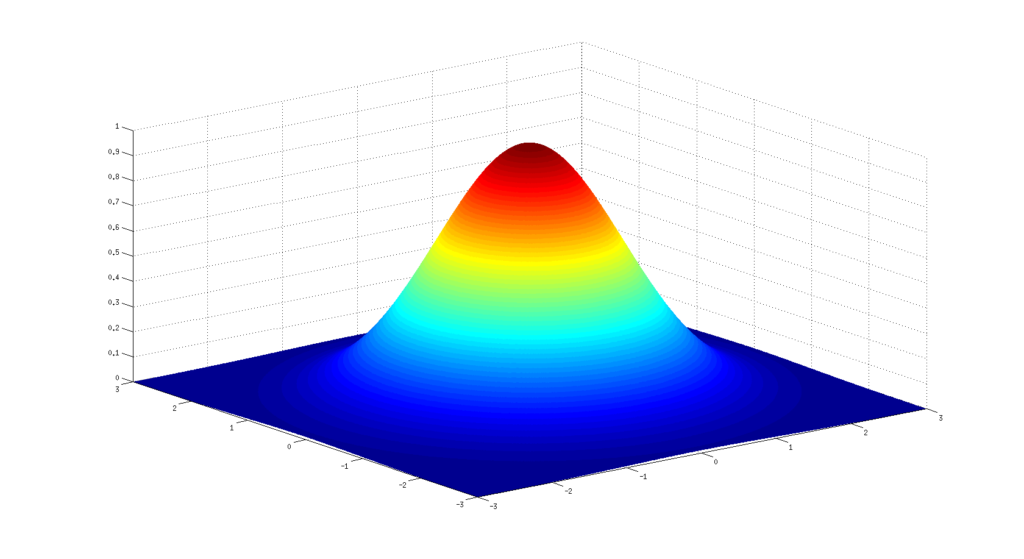
The results of an experimental program tests prepare to develop probabilistic models for the concrete compressive strength for different projects and managerial process.
The results indicate that the ready mix quality control is better quality control than the mix on site. Moreover, the degree of the ready mix quality control is function of the required concrete grade to deliver on site.
The study is concentrated about four level of project management with different concrete grades. The probabilistic models which is present the concrete compressive strength verified by the chai-square and Kolomogrove-Simrnov goodness for fit tests at the 5% confidence level.
These models developed in this paper are useful for predicting the performance of structural elements and assessing the reliability level. From this research one can find that each contractor with his organization and quality management level can be useful to define the level of reliability which impact with design factors.
For high quality management system it is proposed to reduce the safety factors on the other sided for poor management system as for small project it is needed to increase the safety factors as a final for any management system maintain the same reliability level. In case of ready mix , in case of lower grade around 20 MPa and higher concrete grade around 40 and 45 MPa the concrete compressive strength is well presented by normal distribution. For concrete grade 30 and 35 MPa the concrete compressive strength is well presented by lognormal distribution.
Recently, structural reliability has several important applications in the field of civil engineering. Due to different source of uncertainty in concrete construction industry the reliability theory is worth to use it to define the factors of safety for limiting state design codes based on the acceptable level probability of failure. The reliability-based design have been used successfully in the development of design codes for reinforced concrete structure.
For limiting state design method for reinforcing concrete structures based mainly of the variability of load and resistance. The reliability based design provides a formal framework for developing design criteria which ensure that the probability of unexpected performance is acceptable in a small level.
For strength in this research concentrate about the concrete compressive strength which any concrete design equation sensitive to any variation in concrete strength . Therefore, the variation of the compressive concrete strength will affect on the integrity structure reliability.
For different codes as ACI, BS, and EC which based on load and resistance factors in limiting state design, depend on safety factor. These factors have relation to the safety index value. So the variation on quality control to define the reasonable factor of safety.
BACKGROUND
For the quality control of concrete specimen, Ellingowood estimated the c.o.v to be 20.7% in the average control . Freudenthal et al reported that concrete compressive strength (fc) distribution is conform to a lognormal distribution in case of poor quality control. Mirza et al, describe the c.o.v of the insitu compressive strength of concrete grades 35 and 20 Mpa are estimated to be 0.15 and 0.18 respectively Arafa A.M (1997) present that the c.o.v of strength in site mixed concrete was observed to be high varied between 0.3 to 0.4 and presented by lognormal distribution., indicating the poor quality and below standard production method of this of concrete.
In the reliability based limit state design, The limit state equation is a function of the resistance; R, of the structural element and of the load effect; S, acting on it; R and S, are random variables.

Z = R / L (1)
since R and S are random variable the Z is also random variables.
R and S are calculated from the equation of design the required member through the relation between load and member strength which represent by member geometry and material strength.
According to Ang and Tang (1984), Z is normally distributed random variable if R and S are lognormal distributed variables.
The required target reliability index in different design codes is usually select depend on the type of failure if its brittle or ductile failure and depend also on the consequence s of failure.
As an example the NORDIC committee on building regulations (1978) has recommend a different reliability indices as choose it equal to 3.09 which present probability of failure (Pf= 10-3) for ductile and non serious consequence and select the reliability index equal to 5.3 (Pf= 10-7) for brittle and serious type of failure. The American Society of Civil Engineering criteria (ASCE 7-93) are based on a target reliability index of 3.0 for ductile failures such as under reinforced beams and spiral columns and equal to 3.5 for brittle failure such as shear and tied column Ellingwood,(1980).
Experimental program
The main objective of the experimental program is to collect concrete samples records from different projects in Egypt varied between high project cost, medium and low project.
The different project cost depend on size of the project and consequently different organization size for big project the organization for contractor, consultant and owner will be higher that that in case of small project.
In all these projects for this phase of study are using ready mix concrete so the impact of the organization will focus on the good contract document between contractor and concrete manufacturer and the experience of the owner and the consultant on the auditing procedure on the concrete manufacturer site of mixing as quality assurance procedure.
The probabilistic models for the previous data which is around 500 concrete sample comprises standard cubes (150 X 150 X150 mm) which after 24 hrs transferred to the laboratory which they were cured after 28 days before compression tests and all test specifications and procedure are according to Egyptian codes of specifications.
The following is the data analysis for the different contractors is performed by using crystal ball program and calculate the chai square and the K_S value to select the most probability distribution which conform with the data.
TESTING OF THE SUGGESTED MOD
After the model distribution is obtained by the drawing of the frequency curve for compression test in all the contractor, the data is tested with the common distributions by using chi square (c2) which is goodness-of-test is applied to continuous random variables.
where Oi and Ei is the observed and expected number of occurrences in the ith interval, respectively, and k is the number of interval.
Moreover, the Kolmograv-Smirnov (K-S) test is done which is a second quantitative goodness-of-fit test based on a second test statistic. It concentrates on the deviations between the hypothesized cumulative distribution function and the observed cumulative data. and the calculation of the test.
Moreover, the test by the above two methods is performed by the Crystall Ball program (1996) to test the suggested model with the more traditional probability distributions.
Results, analysis and discussion
The results of the two tests with some hypothesized probability distribution are shown in Table (1) and from this table one can find that the least value for the two tests is at hypothesize a lognormal distribution. Beside to that, the relations between the suggested model and the different probability distributions are shown in Table (2) which obvious that the model is more coincidence with the lognormal distributions than others.
Noting that project (A) is big project than (B) and so on. But all these projects using ready mix concrete in Table (1) present the project and the required concrete compressive strength and the related bias factor, however bias factor is the ratio between the mean compressive strength to the nominal value which is fc. For different contractor and concrete grade the coefficient of variation is illustrated in the table.
Table (1) Statistical Parameters for Different Projects
Project | fc | Bias factor | C.O.V |
(A) | 22.5 | 1.03 | 0.12 |
(A) | 35 | 1.03 | 0.20 |
(B ) | 40 | 1.11 | 0.15 |
(C) | 45 | 1.07 | 0.17 |
(D) | 30 | 1.05 | 0.22 |
The tests is performed by comparing the available data with the different probability distribution and found that the best probability distribution represent the data is presented in Table (2)
Table (2) Proposed distribution model for different concrete grades.
Project | fc | Distribution | c2 | K-S |
(A) | 22.5 | Normal | 3 | 0.16 |
(A) | 35 | Lognormal | 13 | 0.18 |
(B ) | 40 | Normal | 0.31 | 0.81 |
(C) | 45 | Normal | 10.92 | 0.07 |
(D) | 30 | Lognormal | 9 | 0.1 |
Its worth to mention that for lower strength around 22.5 MPa and for higher grade above 40 Mpa the well presented model is the normal distribution and for lower grade and high quality control will provide small value for coefficient of variation. and in case for higher concrete grade the coefficient of variation is low.
In case of concrete grade 30 and 35 MPa for different projects the concrete compressive strength is well presented by lognormal distribution with coefficient of variation 0.2 and 0.22 respectively.
In case of low concrete grade it is easy to achieve this strength so the c.o.v is low and the bias factor is around 1.03. Also for higher concrete grade over 40 MPa can use some additives to achieve the higher concrete strength so the bias factor is around 1.11 to 1.07 with c.o.v from 0.15 to 0.17 which is reasonable.
On the other hand, for 30 to 35 MPa these value is between the lower and higher grade so there are highly variation to reach the required grade so the bias factor are 1.03 and 1.05 respectively with higher c.o.v which revealed that for any types of projects its required to increase the quality control procedure in case of required concrete grade 30 and 35MPa.
In any case the coefficient of variation of ready mix is lower than that in case of mixing on site. This is due to no higher quality control and this type of mix is usually performed in a small project with lower cost.
CONCLUSION
For lower grade and higher concrete grade around 40 and 45MPa the concrete compressive strength is well presented by normal distribution. For concrete grade 30 and 35 MPa the concrete compressive strength is well presented by lognormal distribution.
For grade 30 and 35MPa it is required more efficient quality control procedure.
Reference
British Standard Institute, Design of Reinforced concrete structure” (1992) part1: general rules and rules for buildings. BSI, Milton Keynes, Eurocode 2.
COMITE EURO-INTERNATIONAL DU BETON . CEB-FIP Model Code 1990-Design Code. Thomas Telford, London, 1993
American Society of Civil Engineering, Minimum design loads for buildings and other structures. ASCE , New York, 1993, Standard 7-93
Arafa, A. M., (1997) “ Statistics for concrete and steel quality in Saudi Arabia” Magazine of Concrete Research , 49, No. 180, Sept.185-193.
Ellingwood, B. (1978)” Reliability basis of load and resistance factors for reinforced concrete design”, NBS building science series 11. National Bureau of Standards, Washington, DC.
Freudenthal A. M., Garrelts J. M. and Shinozuka M., (1966)“The analysis of structural safety”, J. Struct. Div. ASCE, ,No ST1, 267-325.
Ang, A. H., Tang W. H., (1984)“Probability Concepts in Engineering Planning and Design Volume II Decision, Risk and Reliability ”,John Wiley & sons, Inc.
Nordic Committee on building regulations, recommendation for loading and safety regulation for structural design”, NKB Report No.36, 1978
Ellingwood B., et al. (1980) Development of a probabilistic based load criterion for American national standard A58. Publication 577, National Bureau of Standards, Washington, DC, 1980.
